AI & Technology
Anthropic Introduces Claude Dashboards and Claude Motion for Data Analytics and Visual Storytelling
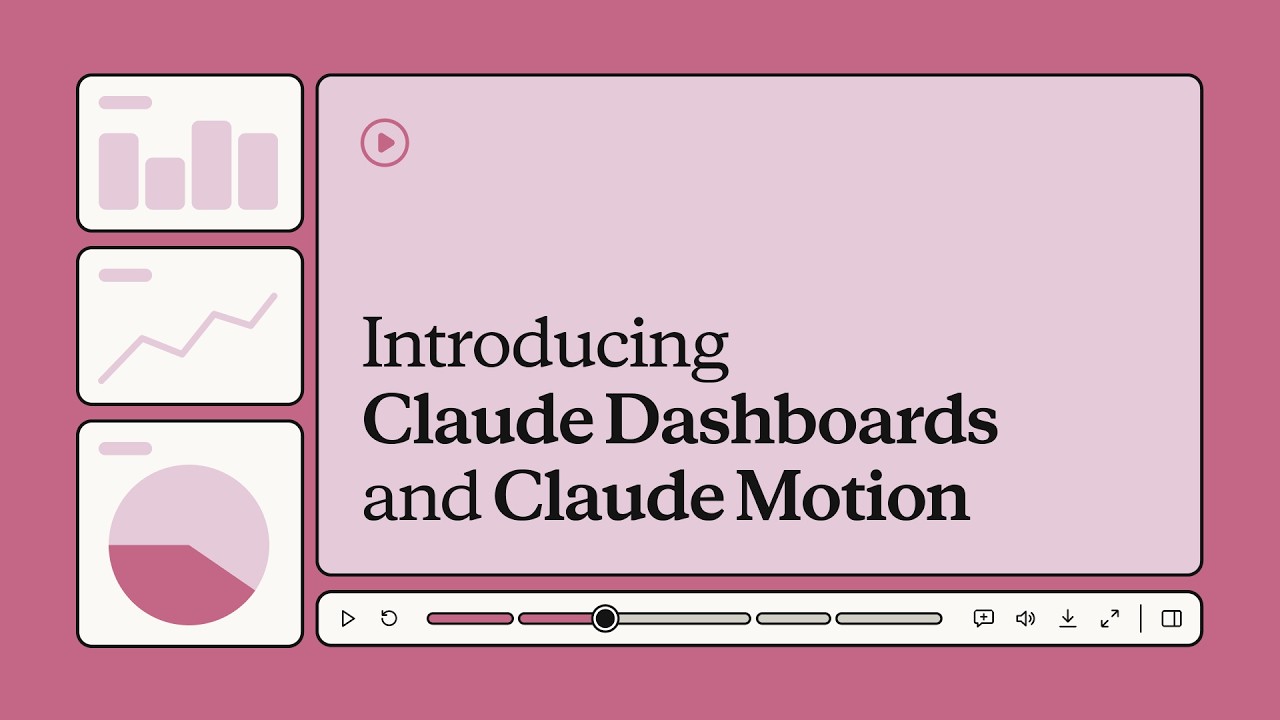
Overview: Next-Gen Analytics and Animated Storytelling
Anthropic has introduced two new AI-powered tools, Claude Dashboards and Claude Motion, designed to make data analysis and visual storytelling easier.
Claude Dashboards helps users build dashboards that connect to their preferred data sources and refresh automatically, while Claude Motion transforms ideas, presentations, and proposals into short explainer videos and animations.
Both tools aim to help teams understand complex information, present insights more effectively, and improve their workflows without replacing their existing software.
What Is Claude Dashboards?
Claude Dashboards is an AI-powered analytics tool that helps users create interactive dashboards using connected business data.
Instead of manually building charts and reports, users can describe what they want to see, and Claude can help organize the information into a visual dashboard.
For example, a business could use Claude Dashboards to monitor monthly revenue, customer growth, sales performance, and other important metrics in one place. Its automatic refresh capabilities can help keep the information current as the underlying data changes.
The tool is designed for teams that want to make data-driven decisions without spending excessive time preparing reports.
What Is Claude Motion?
Claude Motion is an AI-powered visual storytelling tool that turns ideas, presentations, reports, and proposals into short explainer videos and animations.
Users can describe a concept they want to explain, provide relevant content, and guide Claude in creating an animated visual presentation. These animations can help simplify complicated subjects, making them easier for audiences to understand.
For example, a software company could use Claude Motion to explain how its application works, while a marketing team could turn a product proposal into an animated presentation for potential customers.
Unlike tools focused on generating realistic video footage, Claude Motion emphasizes code-based animations, including moving text, charts, shapes, and other visual elements.
When Were Claude Dashboards and Claude Motion Released?
Anthropic announced the two tools on October 8, 2026, according to the announcement associated with this report. They are being introduced in beta, meaning availability and capabilities may depend on the user's account and Anthropic's rollout.
The beta approach allows users to explore the tools while their functionality and availability continue to develop.
How Does Claude Dashboards Work?
Claude Dashboards follows a straightforward workflow:
For example, a user could ask Claude to create a dashboard showing monthly revenue, the five best-selling products, and sales performance across different regions. Claude can use the connected data to help produce a visual overview.
Users should still verify important figures and ensure that the connected data and permissions are configured correctly.
- 1. Connect data sources: Users connect supported data sources containing their business information.
- 2. Describe the requirements: Users tell Claude which metrics, charts, or comparisons they want to see.
- 3. Generate a dashboard: Claude helps organize the data into visual components, such as charts, tables, and key performance indicators.
- 4. Refresh and review: The dashboard can refresh as new data becomes available, helping teams monitor changes without repeatedly rebuilding reports.
How Does Claude Motion Work?
Claude Motion turns written ideas and existing content into animated explanations.
For example, a developer could ask Claude Motion to create a short animation explaining how an API request travels from a frontend application to a backend server and database before returning a response.
This approach can make technical explanations more engaging without requiring users to create every animation manually.
- 1. Provide the content: Users supply an idea, report, presentation, or description of the subject they want to explain.
- 2. Describe the animation: They specify the intended audience, visual style, approximate duration, and key points.
- 3. Generate the visuals: Claude creates an animation using elements such as text, shapes, charts, and transitions.
- 4. Refine the result: Users can request changes to the content, timing, and presentation before exporting the finished animation.
How to Use Claude Dashboards and Claude Motion
Users can begin by visiting Claude's official website and checking whether the tools are available to their accounts.
To use Claude Dashboards, users can connect a supported data source, describe the dashboard they need, and review the charts and metrics Claude generates.
To use Claude Motion, users can provide their content or describe an idea and request an animated explanation. They can then review the generated result, make adjustments, and export the animation if that option is available to their account.
Because both tools are being introduced in beta, users should check Anthropic's official documentation for the latest access requirements, supported integrations, and export options.
Who Can Benefit From These Tools?
Claude Dashboards and Claude Motion serve different but complementary purposes across teams:
- Business teams: Monitor performance and make decisions using visual data.
- Data analysts: Explore information and prepare reports more efficiently.
- Marketing professionals: Turn campaign results and product proposals into understandable visual presentations.
- Developers: Explain APIs, software architecture, and technical workflows through animations.
- Educators and content creators: Make complex subjects easier to understand through visual storytelling.
Claude Dashboards vs. Claude Motion
Claude Dashboards focuses on analyzing and monitoring data, while Claude Motion focuses on presenting ideas through animation.
Focuses on data exploration, live metrics, KPI trackers, and recurring reports over time.
Focuses on concept explanation, narrative flow, dynamic visual walkthroughs, and presentation videos.
Using both tools together could help a team analyze its results with Dashboards and then create an animated explanation of those findings with Motion.
Final Thoughts
Anthropic's Claude Dashboards and Claude Motion demonstrate two practical applications of AI: simplifying data analysis and making information easier to communicate.
Claude Dashboards helps users organize business information into visual reports, while Claude Motion helps transform ideas and documents into animated explanations. Both are designed to complement existing software rather than replace it.
As these tools develop beyond beta, their usefulness will depend on factors such as data integrations, customization options, reliability, and availability. However, they represent an interesting step toward making analytics and visual communication more accessible to people without specialized technical or design skills.
The Analytics & Visual Communication Shift
From “Manual dashboard building and complex animation software”
To “Prompt-driven live data dashboards and instant code-animated explainer videos.”